In 2026, transit footfall around MRT/LRT nodes will increasingly set the rent and yield tone for shop offices. Here’s a practical playbook—from footfall signals to a rent-pricing model—you can use to benchmark deals near stations.
Transit-Led Retail in 2026: How MRT/LRT Footfall Reprices Shop Offices
Quick take: In 2026, locations within a short walk of MRT/LRT platforms will increasingly set the benchmark for shop-office rents and yields. This guide shows you the signals to track around each station and a simple way to translate footfall into achievable rents.
Why Transit Footfall Matters in 2026
- Time-value of convenience: Commuters and nearby residents gravitate to ground-floor F&B and services steps from the station.
- Daily, repeat demand: Footfall tied to commuting, education, and healthcare provides resilient spend even in softer cycles.
- Tenant competition: F&B, grocers, pharmacies, clinics, and convenience chains prefer transit-adjacent corridors, supporting rent premiums.
- Capital flows: Investors prize predictable cashflows; transit nodes create defensible micro-catchments.
Signals to Track Around Each Station
1) Catchment & Footfall
- Measured footfall: Manual counts at AM/PM peaks and weekends (15–30 min samples, extrapolated).
- Catchment layers: Residents within 400–800m, day workers, students, and weekend visitors.
- Trip purpose mix: Commute vs leisure—leisure-heavy nodes tend to support stronger weekend rents.
2) Tenant Mix & Anchors
- Essential services: minimarts, pharmacies, clinics, repair shops—defensive occupiers anchor spend.
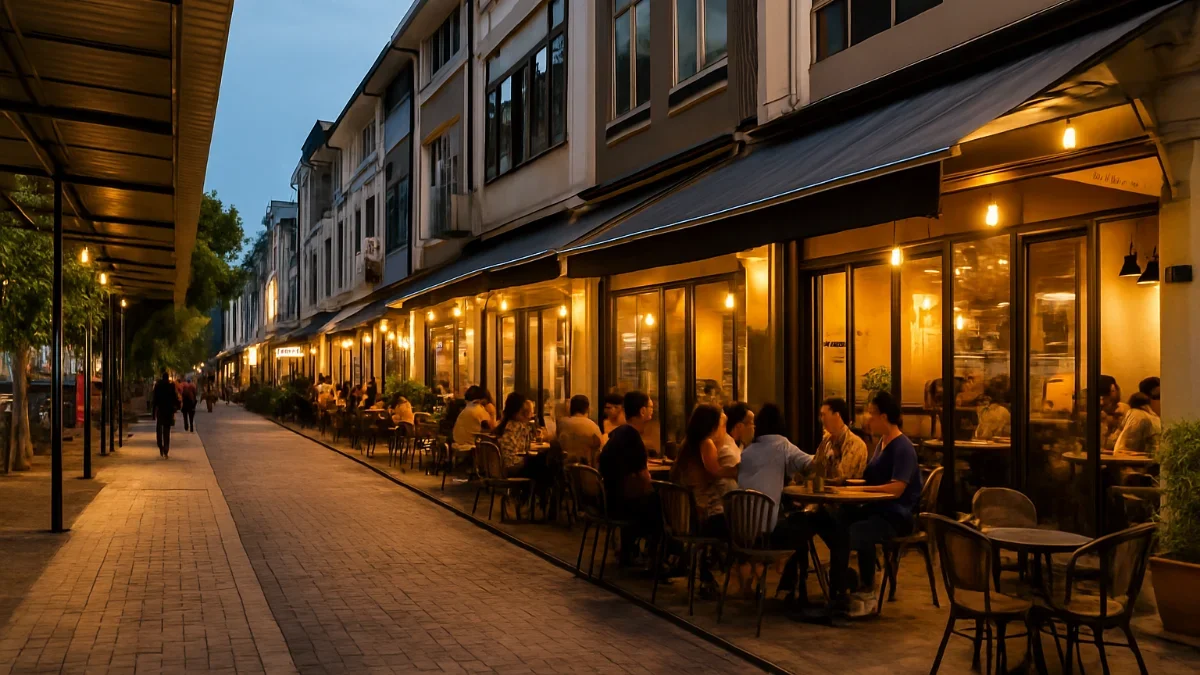
- F&B spectrum: quick-serve (breakfast/commuter), cafés (afternoon dwell), family dining (evening).
- Institutional magnets: proximity to campuses, hospitals, government complexes and offices.
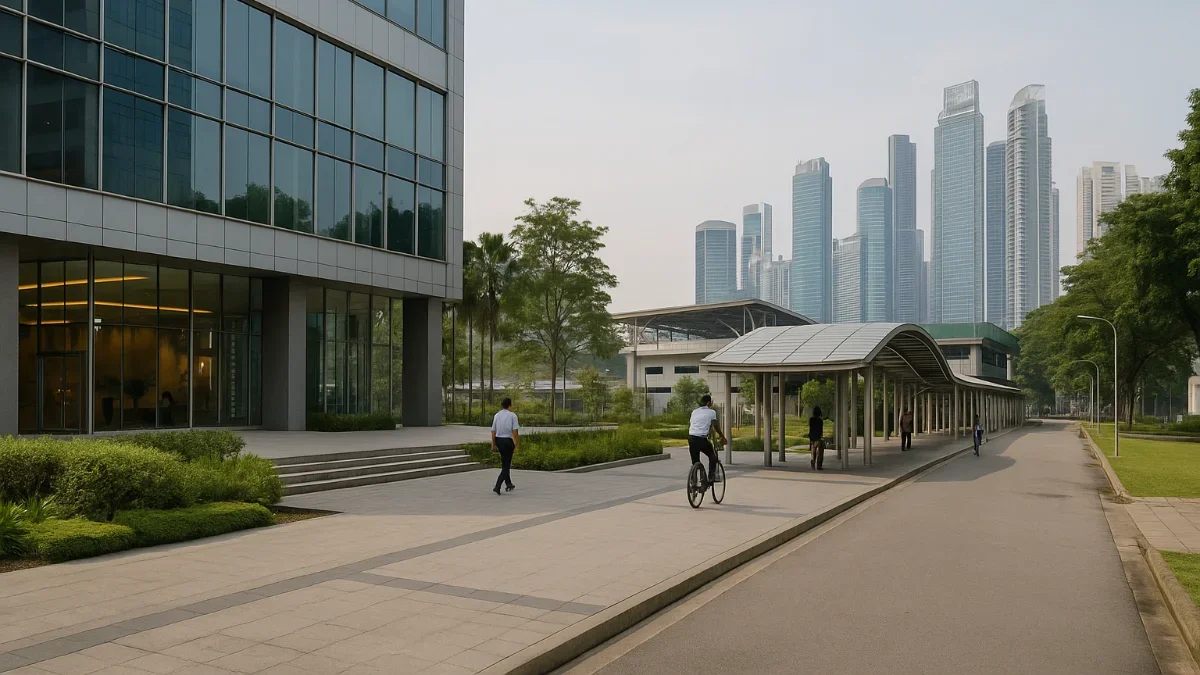
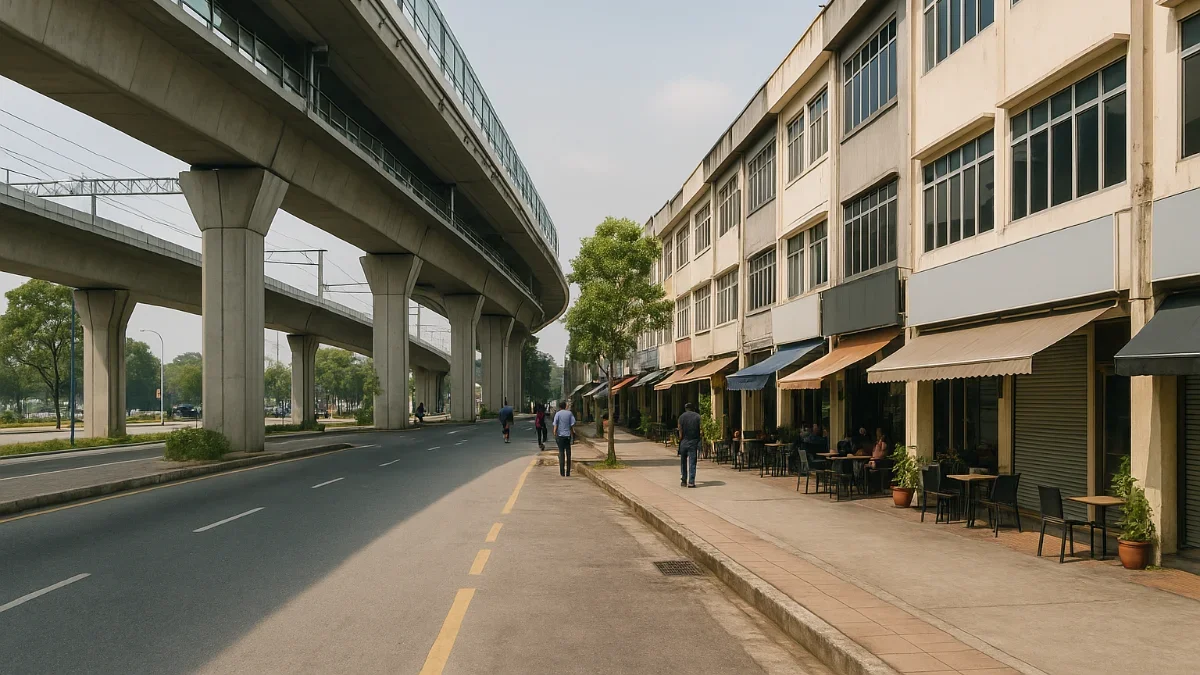
3) Accessibility & Micro-Location
- Walking distance: 1–5 minutes is ideal; safe crossings, shaded walkways, covered links add value.
- Dual frontage: visibility from both station egress and the main road improves capture.
- Parking & drop-off: weekend car access matters even for rail-first locations.
4) Operating Fundamentals
- Grease trap & ventilation: F&B-ready units lease faster and at better rates.
- Power & water capacity: sufficient amperage and water supply for restaurant use.
- Ceiling height & frontage width: improves signage, seating layout, and brand visibility.
Pricing Framework: From Footfall to Rent
Use a simple footfall ? capture ? spend ? occupancy cost chain to estimate sustainable rent. Replace the placeholders with local counts and ticket sizes.
- Daily footfall near your frontage (F): measured or conservatively estimated at peak and off-peak.
- Capture rate (C%): share of passers-by who become customers (0.5–2.5% typical for F&B kiosks; 0.2–1.0% for sit-down).
- Average ticket (T): RM per transaction (e.g., RM12–RM25 QSR; RM25–RM45 café; RM40–RM80 casual dine).
- Days open (D): 360–365 for most F&B.
- Tenant occupancy cost ratio (OCR): rent as % of gross sales (typically 8–12% for F&B; 5–8% for grocers/pharmacies).
Indicative formula:
Sustainable Annual Rent ˜ (F × C% × T × D) × OCR
Example (illustrative only): If F = 8,000/day, C = 1.0%, T = RM20, D = 360, and OCR = 10% ? Sales ˜ RM576,000/yr ? Sustainable rent ˜ RM57,600/yr (~RM4,800/month). Adjust for unit size to derive RM psf and compare with market asks.
What Types of Shop Offices Could Outperform
- Corner & end lots: dual exposure, more windows, better wayfinding.
- True ground-floor units: step-free access, immediate visibility to alighting passengers.
- Units on the commuter path: located along the most-used station exit or covered link.
- F&B-ready specs: existing kitchen, grease trap, sufficient exhaust and power.
- Dual-trade flexibility: layouts that suit both F&B and essential retail reduce downtime.
Areas & Station Archetypes to Watch
- Interchange nodes: higher, more resilient footfall and longer dwell times.
- Campus/medical clusters: stable weekday demand, supportive of grab-and-go and café formats.
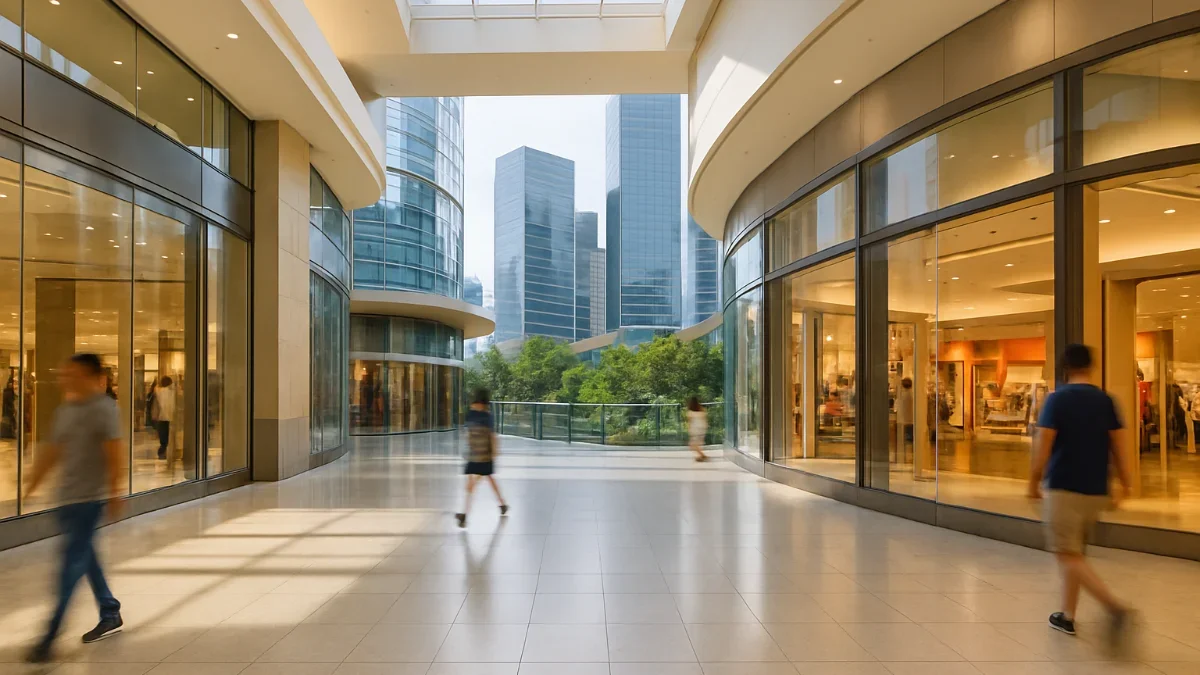
- Integrated mall-station pairs: curated tenant mix and covered access keep weekends strong.
- Newly densifying suburbs: growing rooftops + rail = upgrade path for neighbourhood retail strips.
2026 Risks & How to Mitigate
- Tenant churn: stress-test rent against OCR; seek stronger security deposits and step-up clauses.
- Competition from malls: differentiate with convenience, faster service, and niche offerings.
- Access gaps: if crossings are unsafe or uncovered, budget for wayfinding, lighting, or landlord works.
- Construction phasing: confirm station exits, walkway completion, and surrounding road upgrades before underwriting premiums.
Due Diligence Checklist (Quick)
- Manual footfall counts (AM/PM peaks & weekends) across multiple days and weather conditions.
- Gross vs net lettable area checks; frontage width; signage rights.
- Grease trap, exhaust, three-phase power, water pressure, and extraction routes.
- Parking, drop-off, and delivery access for F&B supply chains.
- Neighbouring tenant sales proxies and rental comparisons within 300–500m.
- State/local approvals (F&B use, outdoor seating, signboard permits).
How Investors Can Use This Playbook
- Shortlist shop-office corridors within a 3–5 minute walk of MRT/LRT platforms.
- Quantify footfall & capture; match to feasible tenants and OCR targets.
- Underwrite rent psf, vacancy, incentives, and capex for F&B readiness.
- Position for resilient yields with essential services and all-day demand drivers.