Which format will win rents and yields in 2026—community (neighbourhood) malls or open-air lifestyle streets? We compare footfall, dwell time, tenant mix, OCR targets, and give a scoring matrix you can use in underwriting.
Neighbourhood Malls vs Lifestyle Streets: Rental Signals into 2026
Quick take: In 2026, both neighbourhood (community) malls and open-air lifestyle streets can outperform—but for different reasons. Malls win on curated anchors, climate control and weekend family traffic; lifestyle streets win on authenticity, evening F&B demand and lower opex for tenants. This guide shows how to read the rental signals and underwrite each format with a simple scoring matrix and OCR targets.
Definitions (So We Compare Apples to Apples)
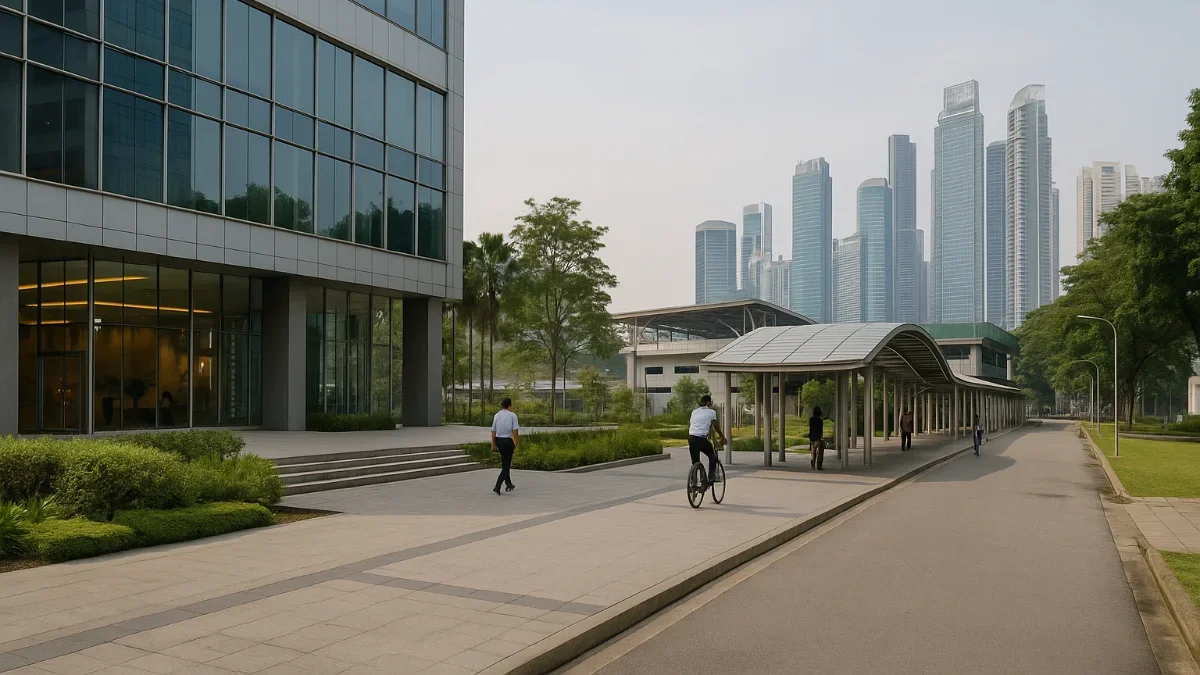
- Neighbourhood Mall: 100k–400k sq ft NLA, community catchment, daily-needs anchors (grocer/pharmacy), enclosed & air-conditioned, structured parking.
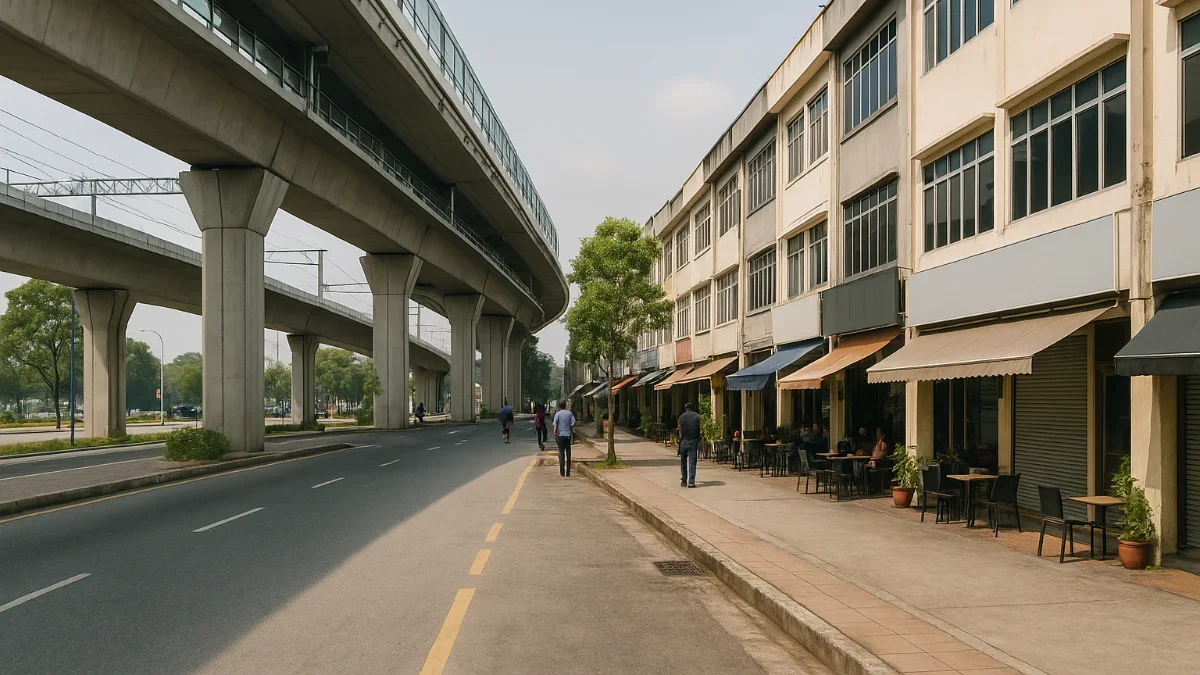
- Lifestyle Street: Open-air row(s) of shop offices along a pedestrian-friendly stretch; strong F&B, cafés, fitness, clinics, beauty; street parking plus e-hailing access.
Demand Drivers in 2026
- Household formation & rooftops: New condos/landed supply within 1–3 km favour daily-needs formats (grocer-led malls) and evening F&B in streets.
- Mobility & micro-access: Walkability from transit or dense housing helps both; safe crossings & shaded links amplify streets’ evening trade.
- Experience vs efficiency: Families pick malls for climate comfort; younger diners pick streets for vibe and variety.
- OpEx & service charge: Streets often carry lower occupancy costs for F&B, letting them pay higher base rent per usable floor area.
Rental Signals: Who Outperforms When?
| Signal | Neighbourhood Mall Advantage | Lifestyle Street Advantage |
|---|---|---|
| Daily-needs anchor strength (grocer, pharmacy) | Anchored malls can sustain stable weekday traffic and push base+turnover rents. | Less relevant unless near a large grocer or hypermarket. |
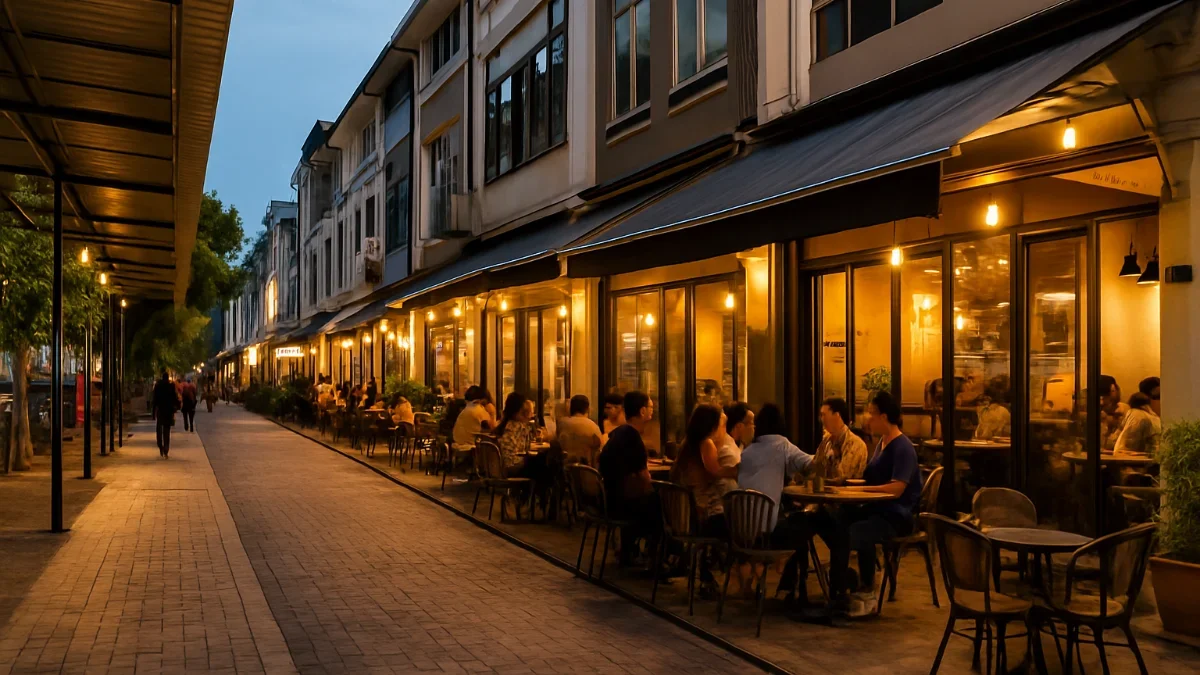
| Evening economy (F&B, bars, dessert) | Food courts & family F&B do fine; weather & closing hours cap upside. | Big upside: al fresco seating, street ambience, later hours drive OCR tolerance. |
| Weather sensitivity | Enclosed comfort = resilient weekend trade. | Weather-proofing (awnings, covered links) becomes critical to maintain sales. |
| Service charge / OpEx | Higher CAM may limit F&B OCR headroom. | Lower OpEx lets tenants accept higher base rent per usable area. |
| Brand roll-out appetite | Chains like the control & co-tenancy protections. | Indie & experiential brands thrive; mix feels “fresh”. |
| Parking & e-hailing | Structured parking is a weekend edge. | Kerbside drop-off works; ensure no choke points at peak hours. |
Underwriting with Occupancy Cost Ratio (OCR)
OCR = Annual Rent / Gross Sales. Use tenant-type benchmarks to back into sustainable rent:
- QSR/Fast-casual F&B: OCR target 8–12%
- Cafés/Dessert: OCR target 10–14%
- Beauty/Clinic/Pharmacy: OCR target 6–10%
- Grocer/DIY: OCR target 3–6% (low-margin, anchor-led)
Formula: Sustainable Annual Rent ˜ (Daily Footfall × Capture % × Average Ticket × Days Open) × OCR
Illustration: A lifestyle street café with 5,000 daily passers-by, 1.0% capture, RM25 ticket, 360 days, OCR 12% ? Sales ˜ RM450k ? Sustainable rent ˜ RM54k/yr (~RM4.5k/mo).
2026 Outlook: Rent Trajectories
- Neighbourhood Malls: Modest rental growth led by necessity anchors, clinics and value dining. Premiums hold where the grocer is strong and parking is easy.
- Lifestyle Streets: Faster rent growth in evening-economy corridors with good shade, awnings and e-hailing access. F&B-ready specs (grease trap, exhaust, 3-phase power) shorten downtime.
Scoring Matrix (Investor Tool)
Score each asset 1–5 (5=best). Weight by importance to derive a comparable score.
| Criterion | Weight | Mall Score | Street Score | Weighted Notes |
|---|---|---|---|---|
| Footfall & Dwell Time | 25% | Peak vs weekend balance; seating saturation; queue length proxies. | ||
| Tenant Mix & Anchors | 20% | Grocer, pharmacy, clinics vs destination F&B & indie brands. | ||
| Accessibility & Parking | 15% | Covered links, safe crossings, e-hailing bay, weekend capacity. | ||
| OpEx / Service Charge | 15% | Cam charges vs street upkeep; impact on OCR headroom. | ||
| F&B-Ready Specs | 15% | Grease trap, exhaust shafts, 3-phase power, water pressure. | ||
| Supply Pipeline / Competition | 10% | New malls nearby? Gentrifying streets? Cannibalisation risk. |
Leasing & Asset Strategies
For Neighbourhood Malls
- Defend anchors with turnover rent and visibility rights; streamline car-park flow.
- Curate daily-needs + clinics + value F&B to stabilise weekday sales.
- Activate edges: outdoor kiosks, weekend pop-ups to add “street energy”.
For Lifestyle Streets
- Invest in shade, lighting and covered walkways to de-weather the street.
- Prioritise F&B-ready infrastructure; enable spill-out seating where allowed.
- Wayfinding + e-hailing bays to smooth peak-hour arrivals and deliveries.
Key Risks & How to Mitigate
- Weather & heat (streets): Awnings, trees, misting & evening programming.
- CAM inflation (malls): Efficiency retrofits; renegotiate service bundles; solar offsets.
- Tenant churn: Use OCR-based rent setting; offer fit-out periods; curate complementary trades.
- Access bottlenecks: Improve crossings, signal timing, and drop-off design.
Due Diligence Checklist (Copy-Paste)
- Manual footfall counts (AM/PM peaks, weekend evenings), dwell-time observation.
- Tenant sales proxies and OCR tests for top 5 categories (QSR, café, dessert, clinic, pharmacy).
- Service charge / OpEx breakdown vs street upkeep costs.
- Parking turnover studies (15-min intervals) and e-hailing wait times.
- Competing nodes within 5–10 minutes’ drive; pipeline projects.